Creating a Life OS Dashboard Setup in Obsidian for 2024(Part 4)
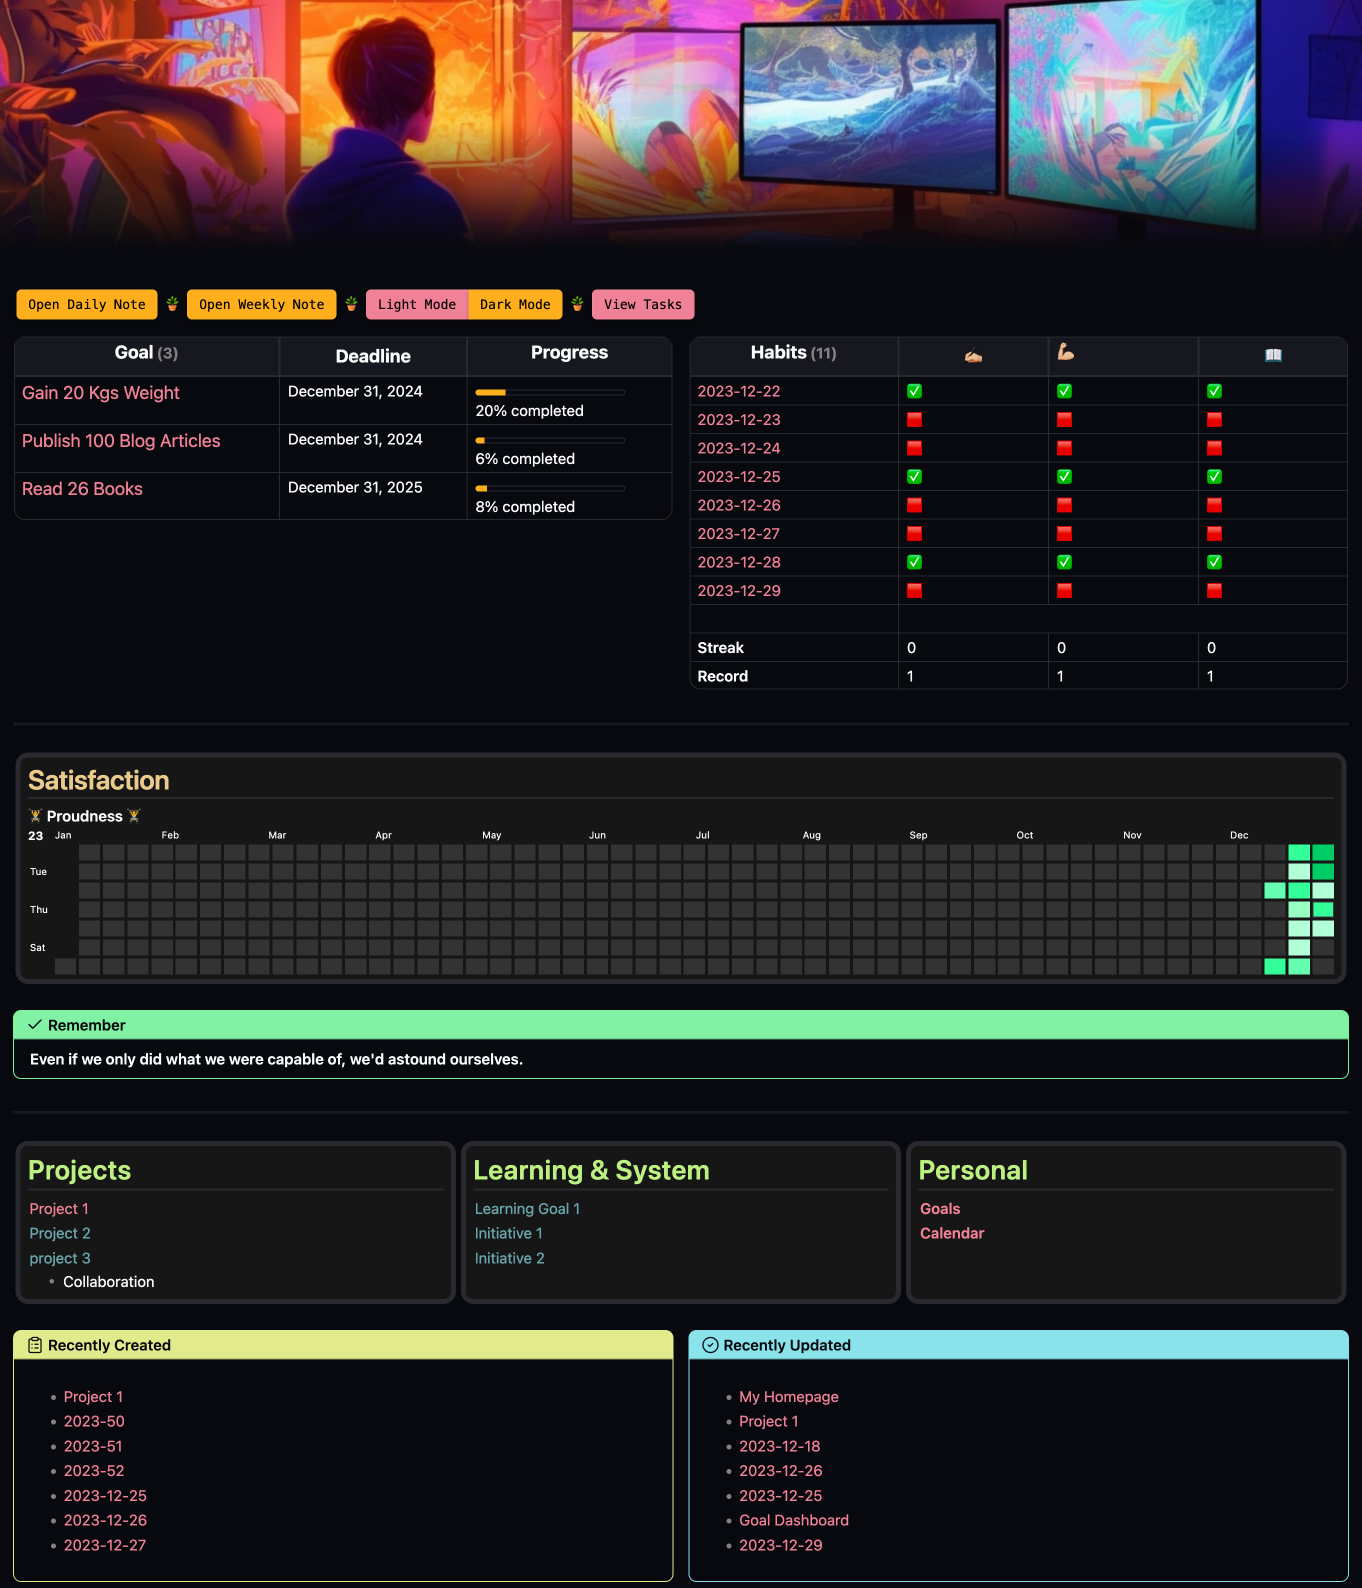
Welcome back to the final edition of this series. This article will help you set up a homepage that looks like this:
I published this screenshot on Reddit and was amazed by the responses. It was hard for many to believe that this was an Obsidian setup.
But worry not, after this article, you will be able to create a much better setup than this. That’s my promise.
So, let’s dive in.
Talking about the elements on the homepage, here is the list in order:
-
Banner on the top
-
Buttons with different functions
-
Goal dashboard
-
1-week habit tracker
-
Heatmap calendar view for tracking
-
Multi-column view with a link to important notes
-
Multi-column view of recently updated and created notes
Banner
I don’t need to talk about the banner here again. Install the plugin. Add gradient style and add a property to your note called banner.
Buttons
These are in-line buttons created with the meta-bind plugin. I told you previously we’ll be using the meta-bind plugin a lot in this setup.
From the beginning till now we’ve been using it. Why? Because the plugin is so good and functional.
It’s hard to teach you about the meta-bind plugin in this article. That can be a different article itself. Check out the documentation section to dive deep into the plugin.
Here, I’ll share what I’ve done on this homepage.
I created in-line buttons to perform certain functions. To do this, you need to create a reference block for the button.
Add this code to the very end of your note.
```meta-bind-button
style: primary
label: Open Daily Note
hidden: true
id: daily-note
action:
type: command
command: daily-notes
```
```meta-bind-button
style: primary
hidden: true
label: Open Weekly Note
id: weekly-note
action:
type: command
command: periodic-notes:open-weekly-note
```
```meta-bind-button
style: destructive
label: View Tasks
hidden: true
id: tasks
action:
type: command
command: card-board:open-card-board-plugin-0
```

```meta-bind-button
style: destructive
label: Light Mode
id: light-mode
hidden: true
actions:
- type: command
command: theme:use-light
```
```meta-bind-button
style: primary
label: Dark Mode
id: dark-mode
hidden: true
actions:
- type: command
command: theme:use-dark
```
All of this code is hidden in the live preview mode. You can assign different functions to each button by changing the command in the code.
To view the available commands, use the following dataviewjs query:
```dataviewjs

const getNestedObject = (nestedObj, pathArr) => {
return pathArr.reduce((obj, key) =>
(obj && obj[key] !== 'undefined') ? obj[key] : undefined, nestedObj);
}

function hilite(keys, how) {
// need to check if existing key combo is overridden by undefining it
if (keys && keys[1][0] !== undefined) {
return how + keys.flat(2).join('+').replace('Mod', 'Ctrl') + how;
} else {
return how + '–' + how;
}
}

function getHotkey(arr, highlight=true) {
let hi = highlight ? '**' : '';
let defkeys = arr.hotkeys ? [[getNestedObject(arr.hotkeys, [0, 'modifiers'])],
[getNestedObject(arr.hotkeys, [0, 'key'])]] : undefined;
let ck = app.hotkeyManager.customKeys[arr.id];
var hotkeys = ck ? [[getNestedObject(ck, [0, 'modifiers'])], [getNestedObject(ck, [0, 'key'])]] : undefined;
return hotkeys ? hilite(hotkeys, hi) : hilite(defkeys, '');
}

let cmds = dv.array(Object.entries(app.commands.commands))
.sort(v => v[1].id, 'asc');

dv.paragraph(cmds.length + " commands currently enabled; " +
"non-default hotkeys <strong>bolded</strong>.<br><br>");

dv.table(["Command ID", "Name in current locale", "Hotkeys"],
cmds.map(v => [
v[1].id,
v[1].name,
getHotkey(v[1]),
])
);
```
All of this will be available in the demo vault. You may download the demo vault directly as well.
Once you have the reference code for your buttons, add the following code block.
`BUTTON[daily-note]` 🪴 `BUTTON[weekly-note]` 🪴 `BUTTON[light-mode, dark-mode]` 🪴 `BUTTON[tasks]`

//Here you use the label from the reference code for buttons.
Goal Tracking

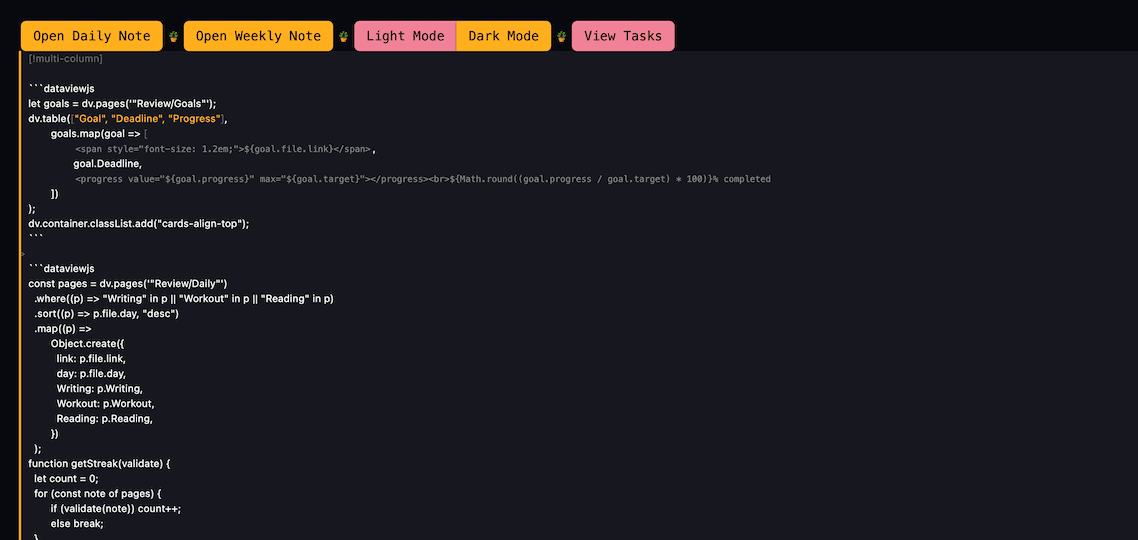
For goal tracking, we use the following dataviewjs query:
> ```dataviewjs
> let goals = dv.pages('"Review/Goals"');
> dv.table(["Goal", "Deadline", "Progress"],
> goals.map(goal => [
> `<span style="font-size: 1.2em;">${goal.file.link}</span>`,
> goal.Deadline,
> `<progress value="${goal.progress}" max="${goal.target}"></progress><br>${Math.round((goal.progress / goal.target) * 100)}% completed`
> ])
> );
> ```
The callout format at the beginning is added to create multi-columns. We’ll talk about it next.
Habit Tracking
The habit tracker displays the results of the last 7 days. Along with that, it displays the current streak and the streak record.

This is all created with a dataviewjs query.
```dataviewjs
> const pages = dv.pages('"Review/Daily"')
> .where((p) => "Writing" in p || "Workout" in p || "Reading" in p)
> .sort((p) => p.file.day, "desc")
> .map((p) =>
> Object.create({
> link: p.file.link,
> day: p.file.day,
> Writing: p.Writing,
> Workout: p.Workout,
> Reading: p.Reading,
> })
> );
> function getStreak(validate) {
> let count = 0;
> for (const note of pages) {
> if (validate(note)) count++;
> else break;
> }
> return count;
> }
> function getRecord(validate) {
> let record = 0;
> let count = 0;
> for (const note of pages) {
> if (validate(note)) {
> count++;
> record = Math.max(record, count);
> } else {
> count = 0;
> }
> }
> return record;
> }
> const done = "✅";
> const skip = "🟥";
> const fileRows = pages
> .filter((p) => p.day >= moment().subtract(1, "w"))
> .sort((p) => p.day)
> .map((note) => [
> note.link,
> note.Writing ? done : skip,
> note.Workout ? done : skip,
> note.Reading ? done : skip,
> ]);
> const writing = [
> getStreak((note) => note.Writing),
> getRecord((note) => note.Writing),
> ];
> const workout = [
> getStreak((note) => note.Workout),
> getRecord((note) => note.Workout),
> ];
> const reading = [
> getStreak((note) => note.Reading),
> getRecord((note) => note.Reading),
> ];
> dv.table(
> ["Habits", "✍🏼", "💪🏼", "📖"],
> [
> ...fileRows,
> [""],
> ["**Streak**", writing[0], workout[0], reading[0]],
> ["**Record**", writing[1], workout[1], reading[1]],
> ]
> );
> ```Creating a multi-column view
To create a multi-column view, we use the Obsidian Modular CSS. This is not a plugin, but a CSS snippet that enables a multi-column view in Obsidian.
To use these, there are two ways you can do it.
First is manually downloading the CSS files from this GitHub repo and adding them to your vault’s snippet folder.
Second, is a more recommended approach. Here’s how you do it.
-
Install Obsidian42- BRAT plugin by tfthacker. It’s available as a community plugin
-
Install the Snippet downloader plugin using BRAT. Use this URL in the input box. Enable the plugin
-
Open the command palette and search for Snippet downloader. Enter this URL in the input box.
Now all of the CSS snippets will be inside the snippets folder which you can enable easily.
If the instructions are hard to follow, here’s the YouTube tutorial.
We added CSS files. Now what?
If you go to the documentation page of Obsidian modular CSS, there’s a lot to play with. We’ll keep it simple and just talk about what’s on my homepage here.
To add this simple multi-column view, add a callout snippet with this code:
> [!multi-column]Leave 1 space after that, and another space after the end of the first column. You can create more columns but I find 2 is a sweet spot for this purpose.
Heatmap Calendar for Tracking
I dedicated an entire article on how to use the heatmap calendar plugin to visualize data in Obsidian.
This calendar view visualizes my satisfaction/proudness level over a year.
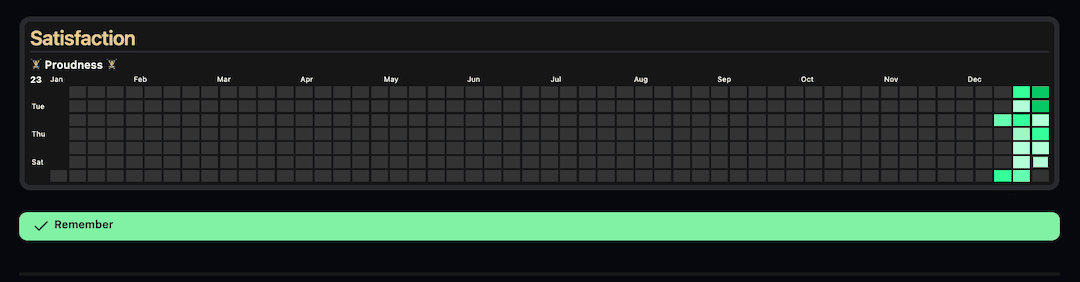
You saw there was a progress bar in our daily notes. Right? We use that data to visualize it over here.
Here’s the snippet:
- ### Satisfaction #mcl/list-card
```dataviewjs
dv.span("**🏋️ Proudness 🏋️**")
const calendarData = {
colors: {
greeny: ["#B3FFD9", "#99FFC2", "#66FFB2", "#33FF99", "#00CC66"]
},
entries: []
}
for(let page of dv.pages('"Review/Daily"').where(p=>p.Proudness)){
calendarData.entries.push({
date: page.file.name,
intensity: page.Proudness,
content: await dv.span(`[](${page.file.name})`), //for hover preview
})
}
renderHeatmapCalendar(this.container, calendarData)
```
This snippet makes use of the modular CSS cards layout to give that look.
Then we have a simple quote below the heatmap calendar.
A simple callout with one of my favorite quotes.
> [!success]+ Remember
> **Even if we only did what we were capable of, we'd astound ourselves.**
Navigation links
This is again created with the modular CSS cards list view.
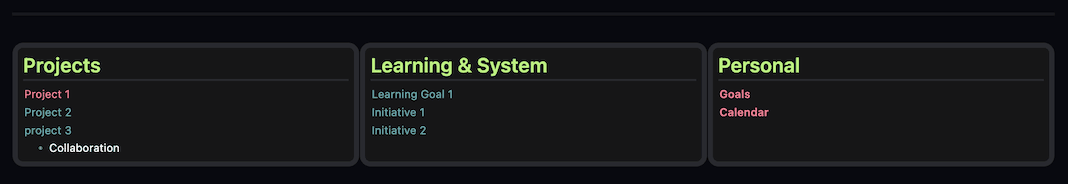
Here’s the snippet:
Recently Created and updated files
This is created with a dataview query and modular CSS snippet beautifully wrapped up around the callout block.
Here’s the snippet:
> [!multi-column]
> > [!summary] Recently Created
>> ```dataview
>> list
>> from ""
>> Sort file.ctime DESC
>> limit 7
>
>> [!Todo] Recently Updated
>> ```dataview
>> list
>> from ""
>> Sort file.mtime DESC
>> limit 7
>>```
And that’s all. You have created a homepage, you would love to come back to every single day.
Obsidian Life OS Demo Vault
Here’s a link to Obsidian Life OS Demo Vault. Download it and follow along with the all tutorials I’ve provided.